
High Grade Gold and Copper in Humboldt County, Nevada
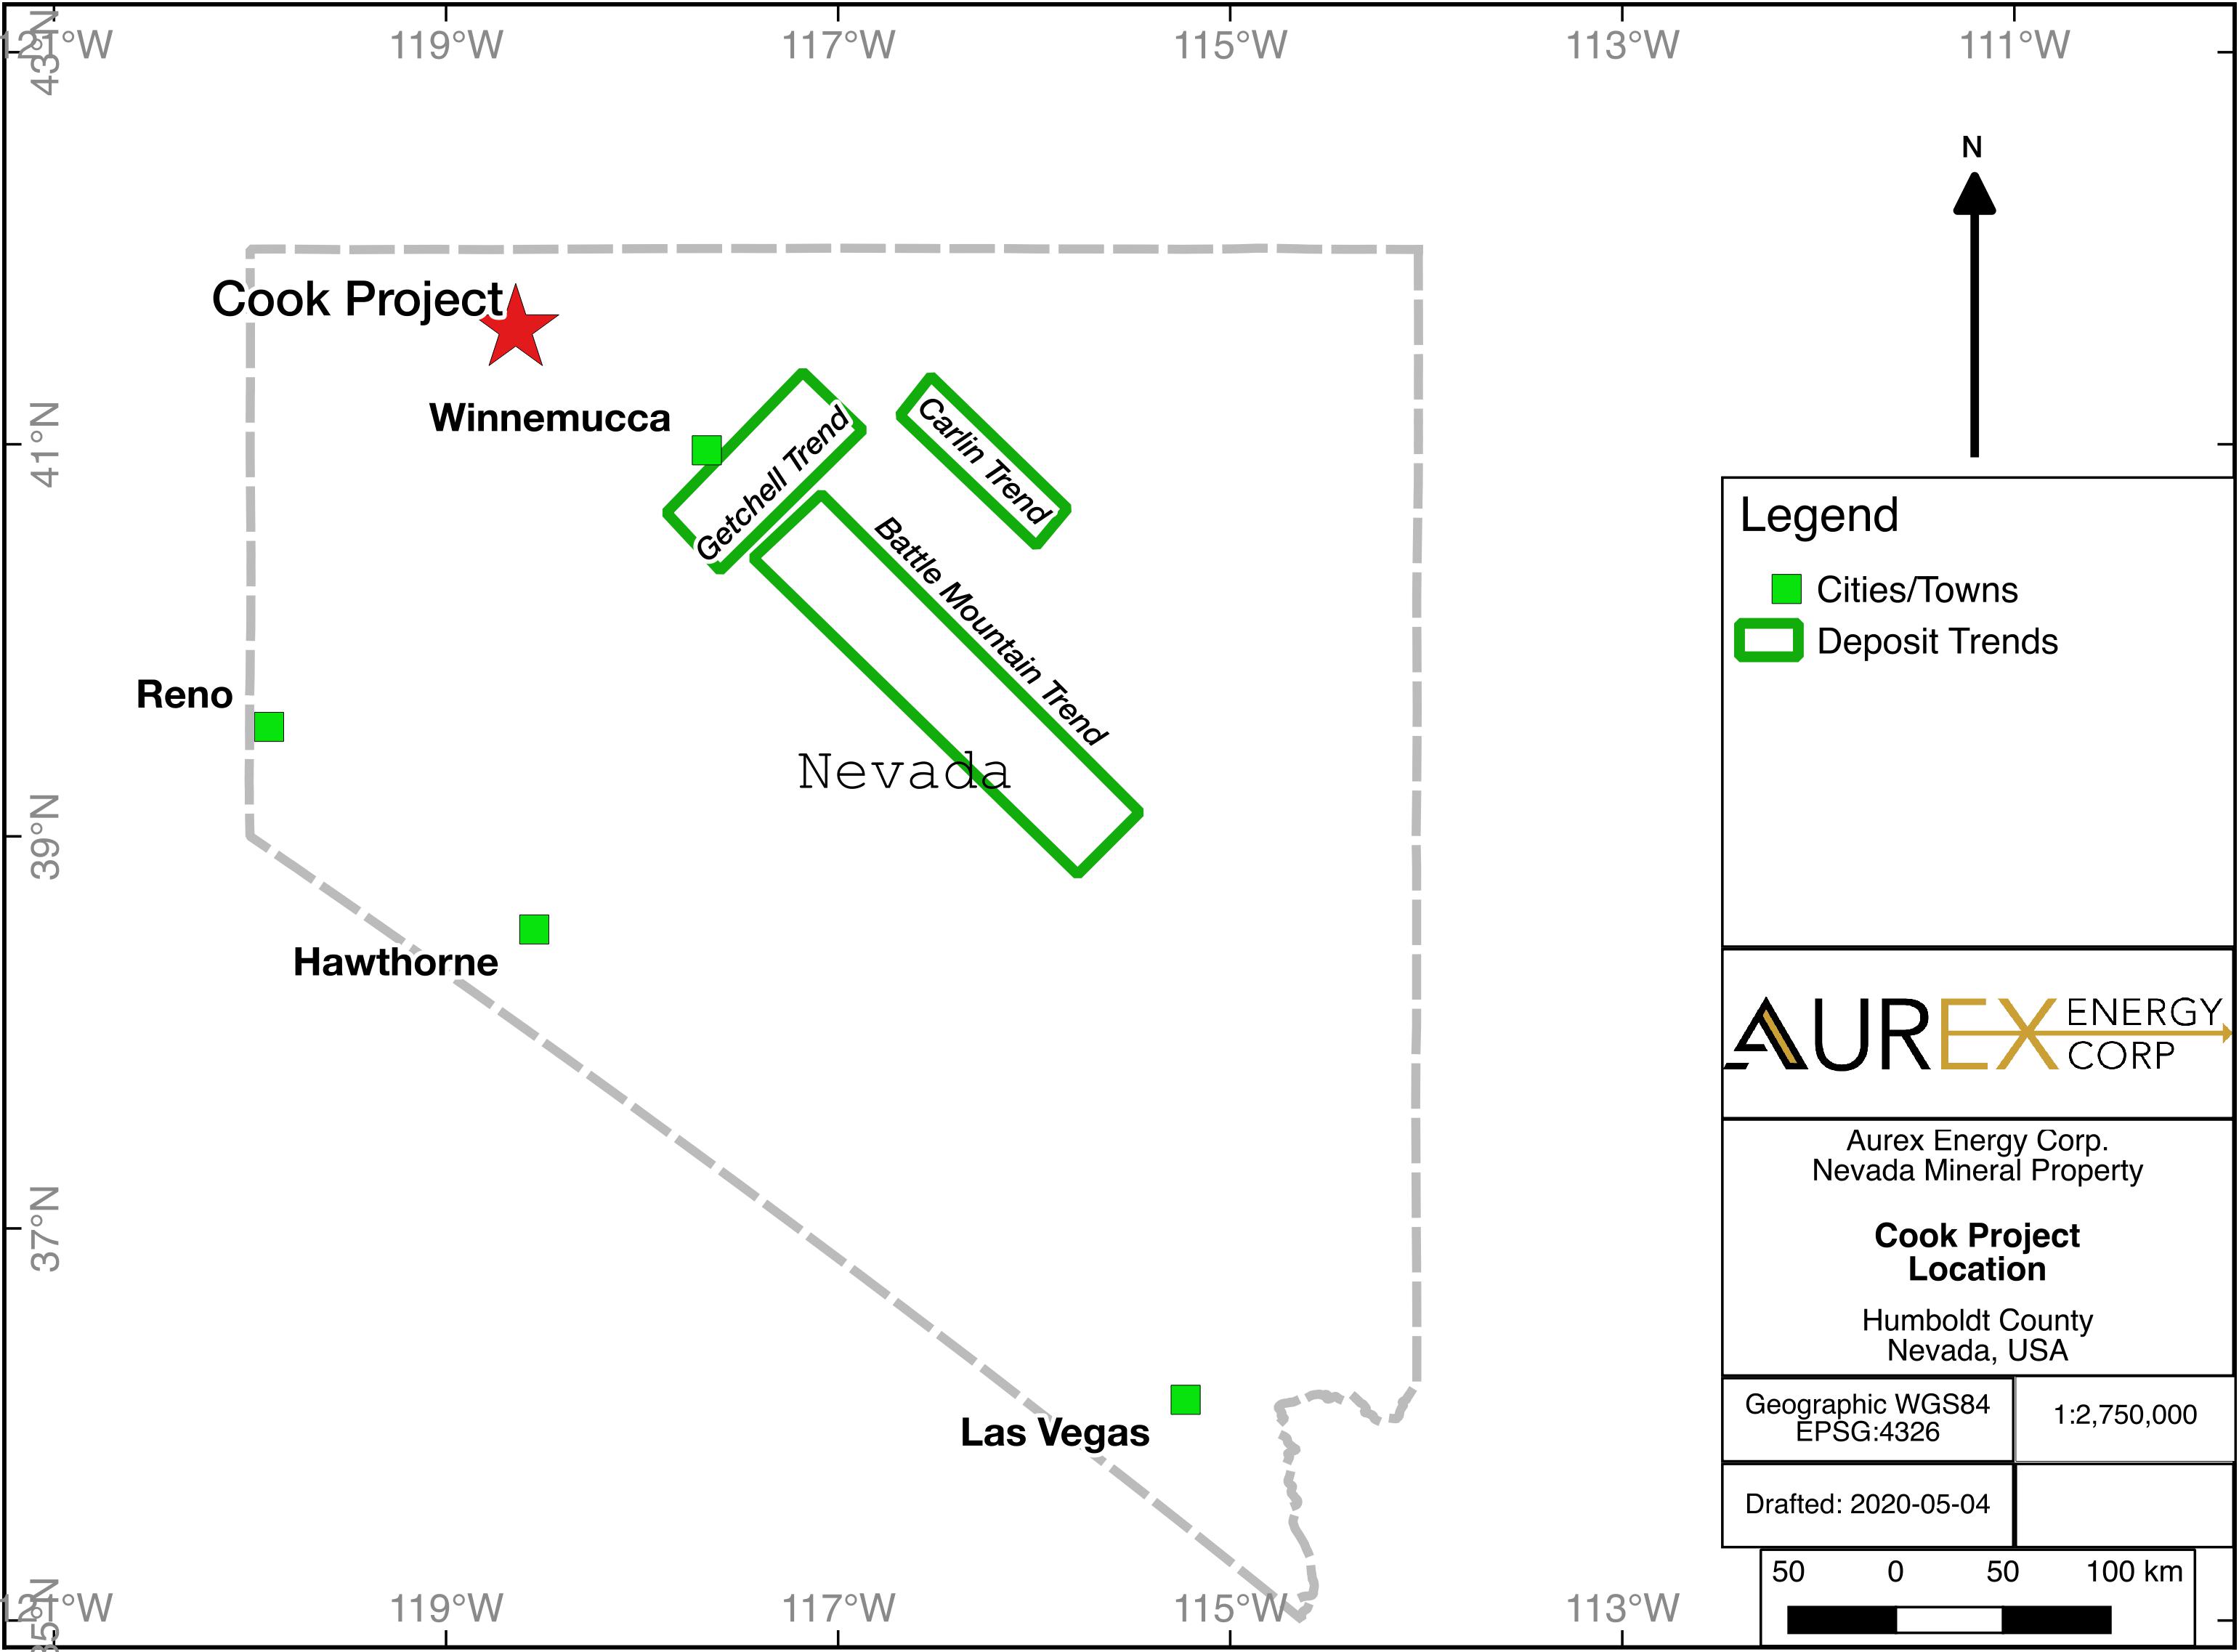
The Company owns a 70% working interest in 88 lode claims, covering 7.4 sq km, located 100 km northwest of Winnemucca, in Humboldt County, Nevada. The property is accessible year-round by all-weather road and four-wheel drive vehicle.
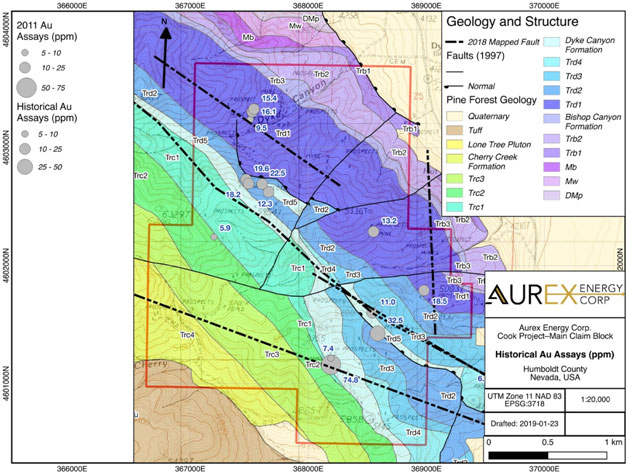
Predominately underlain by Permian intermediate volcanic rocks with a small area of Jurassic limestone in the northeast part of the property, the area has undergone extensive folding and faulting. Breccia zones occur along fold axes and at fault-fold intersections. Regionally, granitic intrusions are also evident.
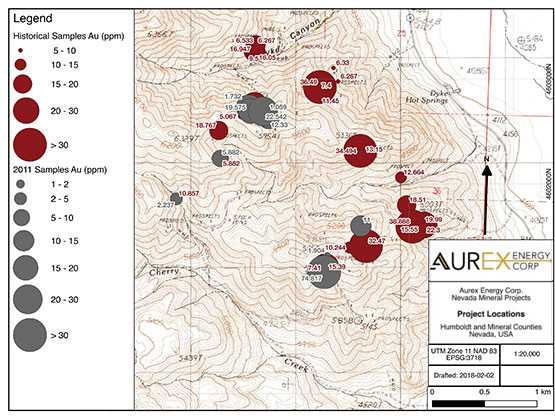
There is extensive gold and copper mineralization across the property, with historic assay results from sampling old mine workings and surface outcrops outlining a corridor of higher grade results with a strike length of 2,100 metres and width of 600 metres. Initial reconnaissance exploration over the property in May and June of 2018 identified 4 major mineralized structures in the corridor hosting high grade gold and copper.
The recent exploration work located, mapped and sampled (where possible), 35 historic mine workings on the property with unknown production. These workings were generally shallow and focused on near-surface oxidized mineralization.
There is very little evidence that any detailed exploration has been carried out on the property, other than surface and limited underground sampling. There are no records of, nor field evidence for, any detailed drilling on the property.
Historic Work
Previous surface sampling over the property resulted in identifying significant gold and copper (with some significant silver) mineralization over a widespread area. Selected results reported in historic geology reports are:
1983-Highlights of sampling carried out by D.H. Sears in the vicinity of old mine workings included:
- Highest gold assay: 46.96 g/t Au (1.37 opt) with 26.40 g/t Ag (0.77 opt) from grab sample at mine adit
- Best chip sample: 19.06 g/t Au (0.56 opt) with 239.96 g/t Ag (7.01 opt) over 3.7 m (12.1 ft) taken underground
2004-Nevada Pacific Gold Ltd. carried out an extensive surface sampling program over the project area. They collected 101 samples for assay. Reporting only results for gold, highlights are:
- 43% of samples assayed over 1 g/t Au (.03 opt)
- 27% of samples assayed over 5 g/t Au(0.15 opt)
- 19% of samples assayed over 10 g/t Au (0.29 opt)
- 3% of samples assayed over 34 g/t (Au0.99 opt)
- Highest gold assay was 38.89 g/t Au (1.14 opt)
Despite these encouraging results, the project never advanced much further as Nevada Pacific subsequently went through two merger/acquisition transactions and the exploration project seemingly was no longer a priority for the new entities.
2011-A private Nevada company carried out another program of surface sampling with the following results:
- 7 areas of significant mineralization were identified that fell within the 2.1 km X 0.6 km main corridor outlined by Nevada Pacific Gold
- Highest gold assay sampled was 74.82 g/t Au (2.18 opt)
- Highest silver assay was 114.3 g/t Ag (3.34 opt)
- Highest copper assay was 3.58% Cu

Current Exploration
Under the management of Axiom Exploration Ltd., of Saskatoon, SK, the following field work was carried out in May and June of 2018:
- An airborne magnetometer survey, carried out by Pioneer Aerial Surveys Ltd.
- Orthomosaic photogrammetry
- A fixed-wing airborne hyperspectral survey carried out by SpecTIR LLC of Reno, Nevada
- An initial surface prospecting, mapping and sampling program
The 2018 exploration program confirmed high-grade gold and copper mineralization on the property. Highlights include:
- 35 historic mine workings located in 7 distinct areas of the property, collecting 69 rock samples, both in situ chip samples and grab samples from mine dumps, for assay.
- High-grade gold mineralization confirmed historic assay results:
- 20 samples (29%) assayed greater than 10g/t (0.3 opt) gold.
- 12 samples (17%) assayed greater than 35g/t (1.0 opt) gold.
- The highest grade gold assay ran 90.9 g/t (2.65 opt) gold from an in situ chip sample
- High-grade copper mineralization, not generally noted in the historic reports, was discovered:
- 19 samples (28%) assayed greater than 0.5% copper.
- 12 samples (17%) assayed greater than 2.0% copper.
- 6 samples (9%) assayed greater than 5.0% copper.
- The highest grade copper assay ran 15.6% copper from a mine dump sample.
- Four major mineralized structures (see descriptions below) were identified from the mapping and assay data:
- Structure 1: strike length 2.1 km, high-grade gold
- Structure 2: strike length 1.75 km, high-grade gold
- Structure 3: strike length 1.95 km, mostly high-grade copper with good gold assays in places
- Structure 4: strike length 1.80 km, high-grade gold
- The hyperspectral survey identified surface alteration dominated by propyllitic alteration that is present over a bedrock exposure area of approximately 6km by 4km. This is indicative of a large mineralizing system, potentially an extension of the Battle Mountain-Eureka gold belt, and has high potential for low sulfidation epithermal gold mineralization (like the nearby Sleeper Mine) and gold-copper porphyry-style mineralization. Phengitic to muscovitic illite and kaolinite are also present and high crystallinity illite appears to be associated with known occurrences of precious metals.


The initial sampling program focused on historic mine workings with in situ chip samples taken where possible and, where not possible, grab samples from rock dumps near the adits and shafts. The mineralization is associated with fault structures and breccia zones in a volcanic host rock. As noted above, 3 of the 4 major linear structures identified are dominated by high-grade gold mineralization and 1 structure is dominated by high-grade copper mineralization. The top 10% gold and copper assays are:
Samples ranked by gold assay
| Sample# | Type | Location/Structure | Au g/t | Au opt | Cu% |
|---|---|---|---|---|---|
| 29739 | In situ | Dyke Canyon/1 | 90.90 | 2.65 | 0.24 |
| 29769 | Mine dump | McDonald Ridge/1 | 64.40 | 1.88 | 5.61 |
| 29758 | In situ | Solo Canyon/3 | 63.90 | 1.86 | 0.34 |
| 29752 | In situ | Copper Canyon/4 | 51.60 | 1.51 | 2.80 |
| 29735 | In situ | Dyke Canyon/1 | 50.10 | 1.46 | 0.59 |
| 29761 | In situ | Solo Canyon/3 | 44.90 | 1.31 | 0.55 |
| 29738 | In situ | Dyke Canyon/1 | 38.20 | 1.12 | 0.29 |
Samples ranked by copper assay
| Sample # | Type | Location | Cu% | Au g/t | Au opt |
|---|---|---|---|---|---|
| 29746 | Mine dump | Copper Canyon/3 | 15.60 | 1.76 | 0.05 |
| 29710 | In situ | Dyke Canyon/3 | 11.20 | 5.98 | 0.17 |
| 29745 | Mine dump | Copper Canyon/3 | 10.60 | 1.14 | 0.03 |
| 29712 | In situ | Dyke Canyon/3 | 8.23 | 0.74 | 0.02 |
| 29769 | Mine dump | McDonald ridge/1 | 5.61 | 64.40 | 1.88 |
| 29711 | In situ | Dyke canyon//3 | 5.00 | 1.88 | 0.05 |
| 29750 | Mine dump | Copper Cayon/3 | 3.48 | 2.45 | 0.07 |
Looking at the individual linear structures, selected assay results are: Structure 1-High-Grade Gold Dominant
| Sample# | Type | Location | Au g/t | Au opt | Cu% |
|---|---|---|---|---|---|
| 29739 | In situ | Dyke Canyon | 90.90 | 2.65 | 0.24 |
| 29769 | Mine dump | McDonald Ridge | 64.40 | 1.88 | 5.61 |
| 29735 | In situ | Dyke Canyon | 50.10 | 1.46 | 0.59 |
| 29738 | In situ | Dyke Canyon | 38.20 | 1.12 | 0.29 |
| 29740 | In situ | Dyke Canyon | 38.00 | 1.11 | 0.04 |
| 29732 | In situ | Dyke Canyon | 36.20 | 1.06 | 0.21 |
| 29734 | In situ | Dyke Canyon | 35.70 | 1.04 | 0.83 |
Structure 2-High-Grade Gold Dominant
| Sample # | Type | Location | Au g/t | Au opt | Cu% |
|---|---|---|---|---|---|
| 29728 | Mine dump | Tiller Mine | 36.00 | 1.05 | 0.05 |
| 29727 | Mine dump | Tiller Mine | 17.40 | 0.51 | 0.06 |
| 29729 | Mine dump | Tiller Mine | 13.90 | 0.41 | 0.05 |
| 29726 | Mine dump | Tiller Mine | 3.19 | 0.09 | 0.03 |
Structure 3-High-Grade Copper Dominant
| Sample # | Type | Location | Au g/t | Au opt | Cu% |
|---|---|---|---|---|---|
| 29746 | Mine dump | Copper Canyon | 1.76 | 0.05 | 15.60 |
| 29710 | In situ | Dyke Canyon | 5.98 | 0.17 | 11.20 |
| 29745 | Mine dump | Copper Canyon | 1.14 | 0.03 | 10.60 |
| 29712 | In situ | Dyke Canyon | 0.74 | 0.02 | 8.23 |
| 29749 | In situ | Copper Canyon | 20.10 | 0.59 | 2.36 |
| 29759 | In situ | Solo Canyon | 37.00 | 1.08 | 0.73 |
| 29761 | In situ | Solo Canyon | 44.90 | 1.31 | 0.55 |
| 29758 | In situ | Solo Canyon | 63.90 | 1.86 | 0.34 |
Structure 4-High-Grade Gold Dominant
| Sample # | Type | Location | Au g/t* | Au opt | Cu% |
|---|---|---|---|---|---|
| 29752 | In situ | Copper Canyon | 51.60 | 1.51 | 2.80 |
| 29733 | In situ | Dyke Canyon | 27.80 | 0.81 | 0.69 |
| 29736 | In situ | Dyke Canyon | 18.50 | 0.54 | 0.82 |
| 29737 | In situ | Dyke Canyon | 12.80 | 0.37 | 0.44 |
| 29725 | In situ | Rattlers Ridge | 7.94 | 0.23 | 0.12 |
The orogenic structural setting found on the Cook property is highly complex with multiple events, orientations and kinematics. Four of the major mineralized structures were identified and focused on during this exploration program and are labeled 1 thru 4 as indicated above. The width of the mapped structures sampled was variable ranging from 0.2m to 1.5m in apparent thickness, which will be more accurately defined during the fall diamond drill program when drill data is available.
Structure 1 is a stacked, shallow-dipping, northwest-southeast striking fault with multiple high grade gold samples taken over a 2.1km strike length. This fault showed features that could be attributable to thrust faulting.
Structure 2 is an east-west striking, steeply-dipping, strike-slip fault system showing 1.5 – 2.0 m dextral offset. This fault intersects the Tiller Mine and extends to the far west area of the southern part of the property, although more infill evidence between the identified 1.75km strike length and the suspected extension is required to increase the confidence of its continuity.
Structure 3 is a northwest-southeast trending, steeply-dipping fault, with strike-slip kinematics. This fault has been ground-proven with multiple exposed locations throughout its 1.95km strike length and is one of the programs highest priority drill targets.
Structure 4 is a north-south trending, steeply dipping, Reidel-type structure with multiple high grade gold samples collected within an alteration zone along its mapped 1.8km strike length.
The project is within 50km of the Sleeper Mine (see map) which was operated by Amax Gold Inc. between 1986 and 1996. Ore reserves reported by Amax in 1987 were 3.4 million tons grading 0.376 opt Au (3.1 million tonnes grading 12.88 g/t) and a lower grade reserve of 44.8 million tons grading 0.021 opt Au (40.6 million tonnes grading 0.72 g/t Au). By 1996 the mill had processed 55 million tons (50 million tonnes) of ore producing 1.68 million ounces of Au and 2.33 million ounces of Ag. The mine is currently being put back into production by Paramount Gold Nevada Corp. who report a Measured and Indicated resource of 294.4 million tonnes (324.5 million tons) grading 0.36 g/t Au (0.01 opt Au) and 3.3 g/t Ag (0.096 opt Ag). The Sleeper Mine is located within the prolific Battle Mountain Eureka trend of gold deposits. This trend hosts several multi-million ounce deposits and over the last 30 years has produced more than 32 million ounces of Au from deposits in the trend. The Cook Gold Project area may well represent the northern extension of the Battle Mountain Eureka trend, but more work and analyses is necessary to make that determination.
“Note that the above reported assay results come mostly from surface grab samples and therefore may not be representative of the actual mineralization hosted on the property.
The reported assays results for the 1983 and 2004 sampling programs come from historical geology reports and the original assay sheets from the assay laboratories were not available for review. Therefore quality assurance and quality control protocols related to the data cannot be verified.
For the 2011 sampling program, the sampling protocol cannot be verified, but the original assay data sheets were available for review and strict QA/QC protocol was followed for sample preparation and analyses. Samples were submitted to Bureau Veritas Mineral Laboratories USA-Inspectorate America Corporation, an ISO certified laboratory in Sparks, Nevada. Standards, blanks and duplicates were included in the sample stream on a regular basis. Analytical methods for Au and Ag were fire assay with atomic absorption finish and a gravimetric finish for Au assays over 10 g/t and Ag assays over 100 g/t. Cu assays over 10,000 ppm were analyzed by atomic absorption spectroscopy.
For the 2018 sampling program, the rock samples collected for assay were submitted to the Saskatchewan Research Council laboratory in Saskatoon, Saskatchewan. Strict QA/QC protocol was followed for sample preparation and analyses. Standards, blanks and duplicates were included in the sample stream on a regular basis. The analytical method for gold was a lead-fusion fire assay with an ICP-OES finish. All other elements, including copper, were analyzed by aqua regia digestion with an ICP-OES finish.
